Bottom line
Optimize survey and research report assets as one system, not a PDF and a press release. Put the method and findings on an indexable web page, build every asset from one number sheet, lead the release with one complete statistic, give experts their own angles and hand sales a kit they can forward. In two security launches I scored, most lost points came from disclosure and editing, and twelve fixes would lift each report by more than 20 points.
B2B marketing teams spend months and real budget on a survey or research report, then lose much of its value in the assets around it. Method hides in a footnote, numbers drift between report and release, and findings sit in a gated PDF that answer engines can't read. This guide shows how to optimize each asset, using the eight rubrics in a Claude skill I built to score a research report or survey and everything around it, with examples from cybersecurity launches.
What good looks like for a research report or survey launch
Original research is one of the biggest content bets a security marketing team makes.
Buyers reward the bet: in a Ponemon Institute and NOLA Marketing study of 320 enterprise cybersecurity decision-makers, research and survey reports had the strongest direct impact of any asset type, at 46%. Here's what a launch that earns its budget back looks like:
| Outcome | What great looks like | KPI that proves it |
|---|---|---|
| Earned coverage | Independent trade and tier-1 stories that name and link your research, still running after week 4 | Independent pickups that link to the hub |
| LLM answers and citations | Answer engines cite your research for category questions and quote your numbers correctly | Share of buyer prompts that cite you; correct statistics |
| Search and backlinks | One series hub that earns links from coverage and ranks for buyer questions, edition after edition | Referring domains; rank for buyer questions |
| Thought leadership | Experts with their own takes, analyst mentions, and bylines that tier-1 outlets accept | Qualified comment rate; invitations; accepted bylines |
| Leads | Findings on the page, a form for the full report, and leads you can trace to each placement | Form fills by placement |
| Sales acceleration | Reps and champions forward a kit built from the findings | Meetings booked; reopened opportunities; deal velocity |
In the skill's terms, good means a report that scores 80 or more and a press release and media score of 85 or more, which takes independent editorial coverage. Launch B, one of the two launches I score below, shows the upside: four months in, its pages ranked first on Google for four of five buyer prompts, and Google's AI Overview and Perplexity cited it for the same four.
What the launch review skill does for reports and surveys
Report launch review is a Claude skill: saved instructions, playbooks and build scripts that Claude follows for one job. Point it at a survey, threat report or telemetry study, and it scores what buyers, reporters and answer engines see:
- the report, its PDF and its landing page
- blogs, the press release, webinars and bylines
- LinkedIn and social, across four voices
- email outreach to customers, partners and prospects
- media pickup, and how search and answer engines cite the research
Each run delivers a scored review page, a PDF, a scores file and a summary, with a number, a source and a fix for every gap. On request, the skill also drafts bylines and outreach emails, which stay drafts until you send them.
Three category settings ship with it, for security, IT operations and cloud, and GRC, covering outlet tiers, benchmarks, buyer prompts and claims to avoid. Rubrics stay fixed, so scores compare across vendors and editions.
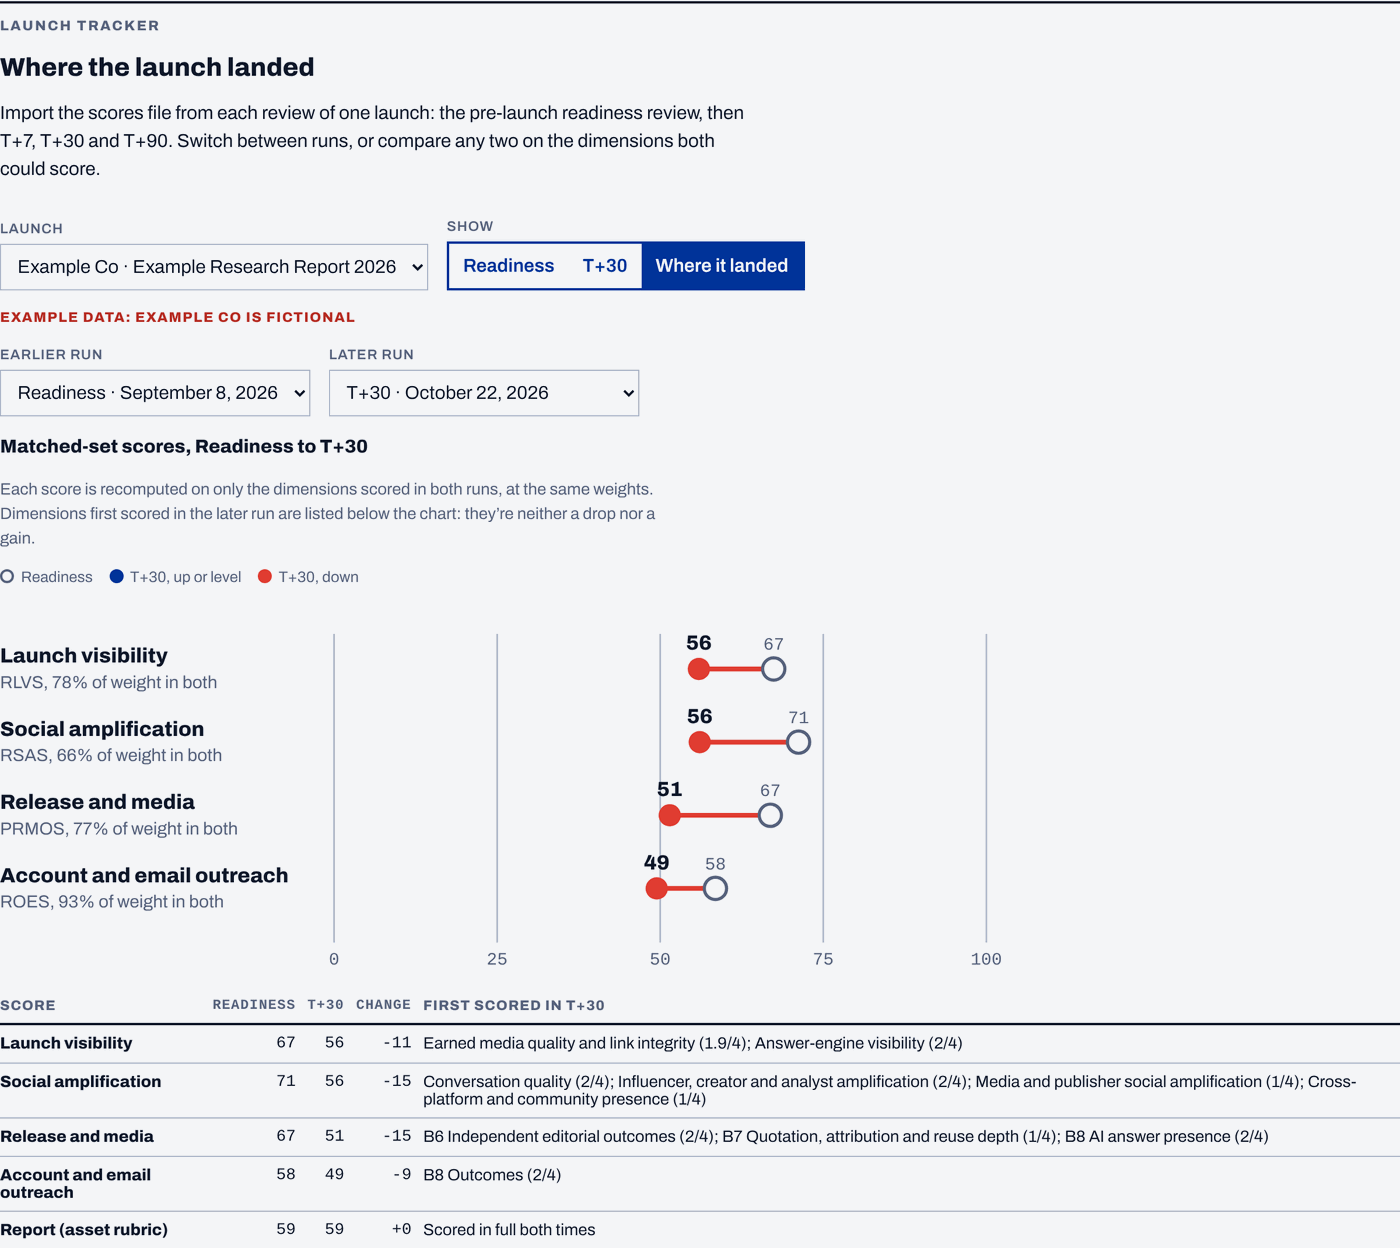
Your team also gets the Launch Review Studio, a private page to edit settings and weights, keep an evidence library and track a launch from readiness review to day 90.

Use it before launch, after launch or on a competitor
| Mode | When | What it reads | Best for |
|---|---|---|---|
| Pre-launch | Before anything ships | Drafts of every asset, plus the pitch list | Research leads and writers: go or no-go |
| Own launch | Day 7, 30 and 90 | Public pages plus your analytics, Search Console, LinkedIn, email and CRM data | CMOs and demand generation |
| Competitor | Any time, at the same launch age | Public pages only | Product marketing and competitive intelligence |
| Client | Any time | Public pages plus client data shared in writing | Agencies and advisors |
Pre-launch blockers:
- numbers that conflict across versions
- no sample size or fielding firm
- findings only behind a form or inside images
- causal claims from survey data
- AI search crawlers blocked on the report page
- any statistic without support
Drafts and embargoed numbers never go into outside tools or buyer prompts.
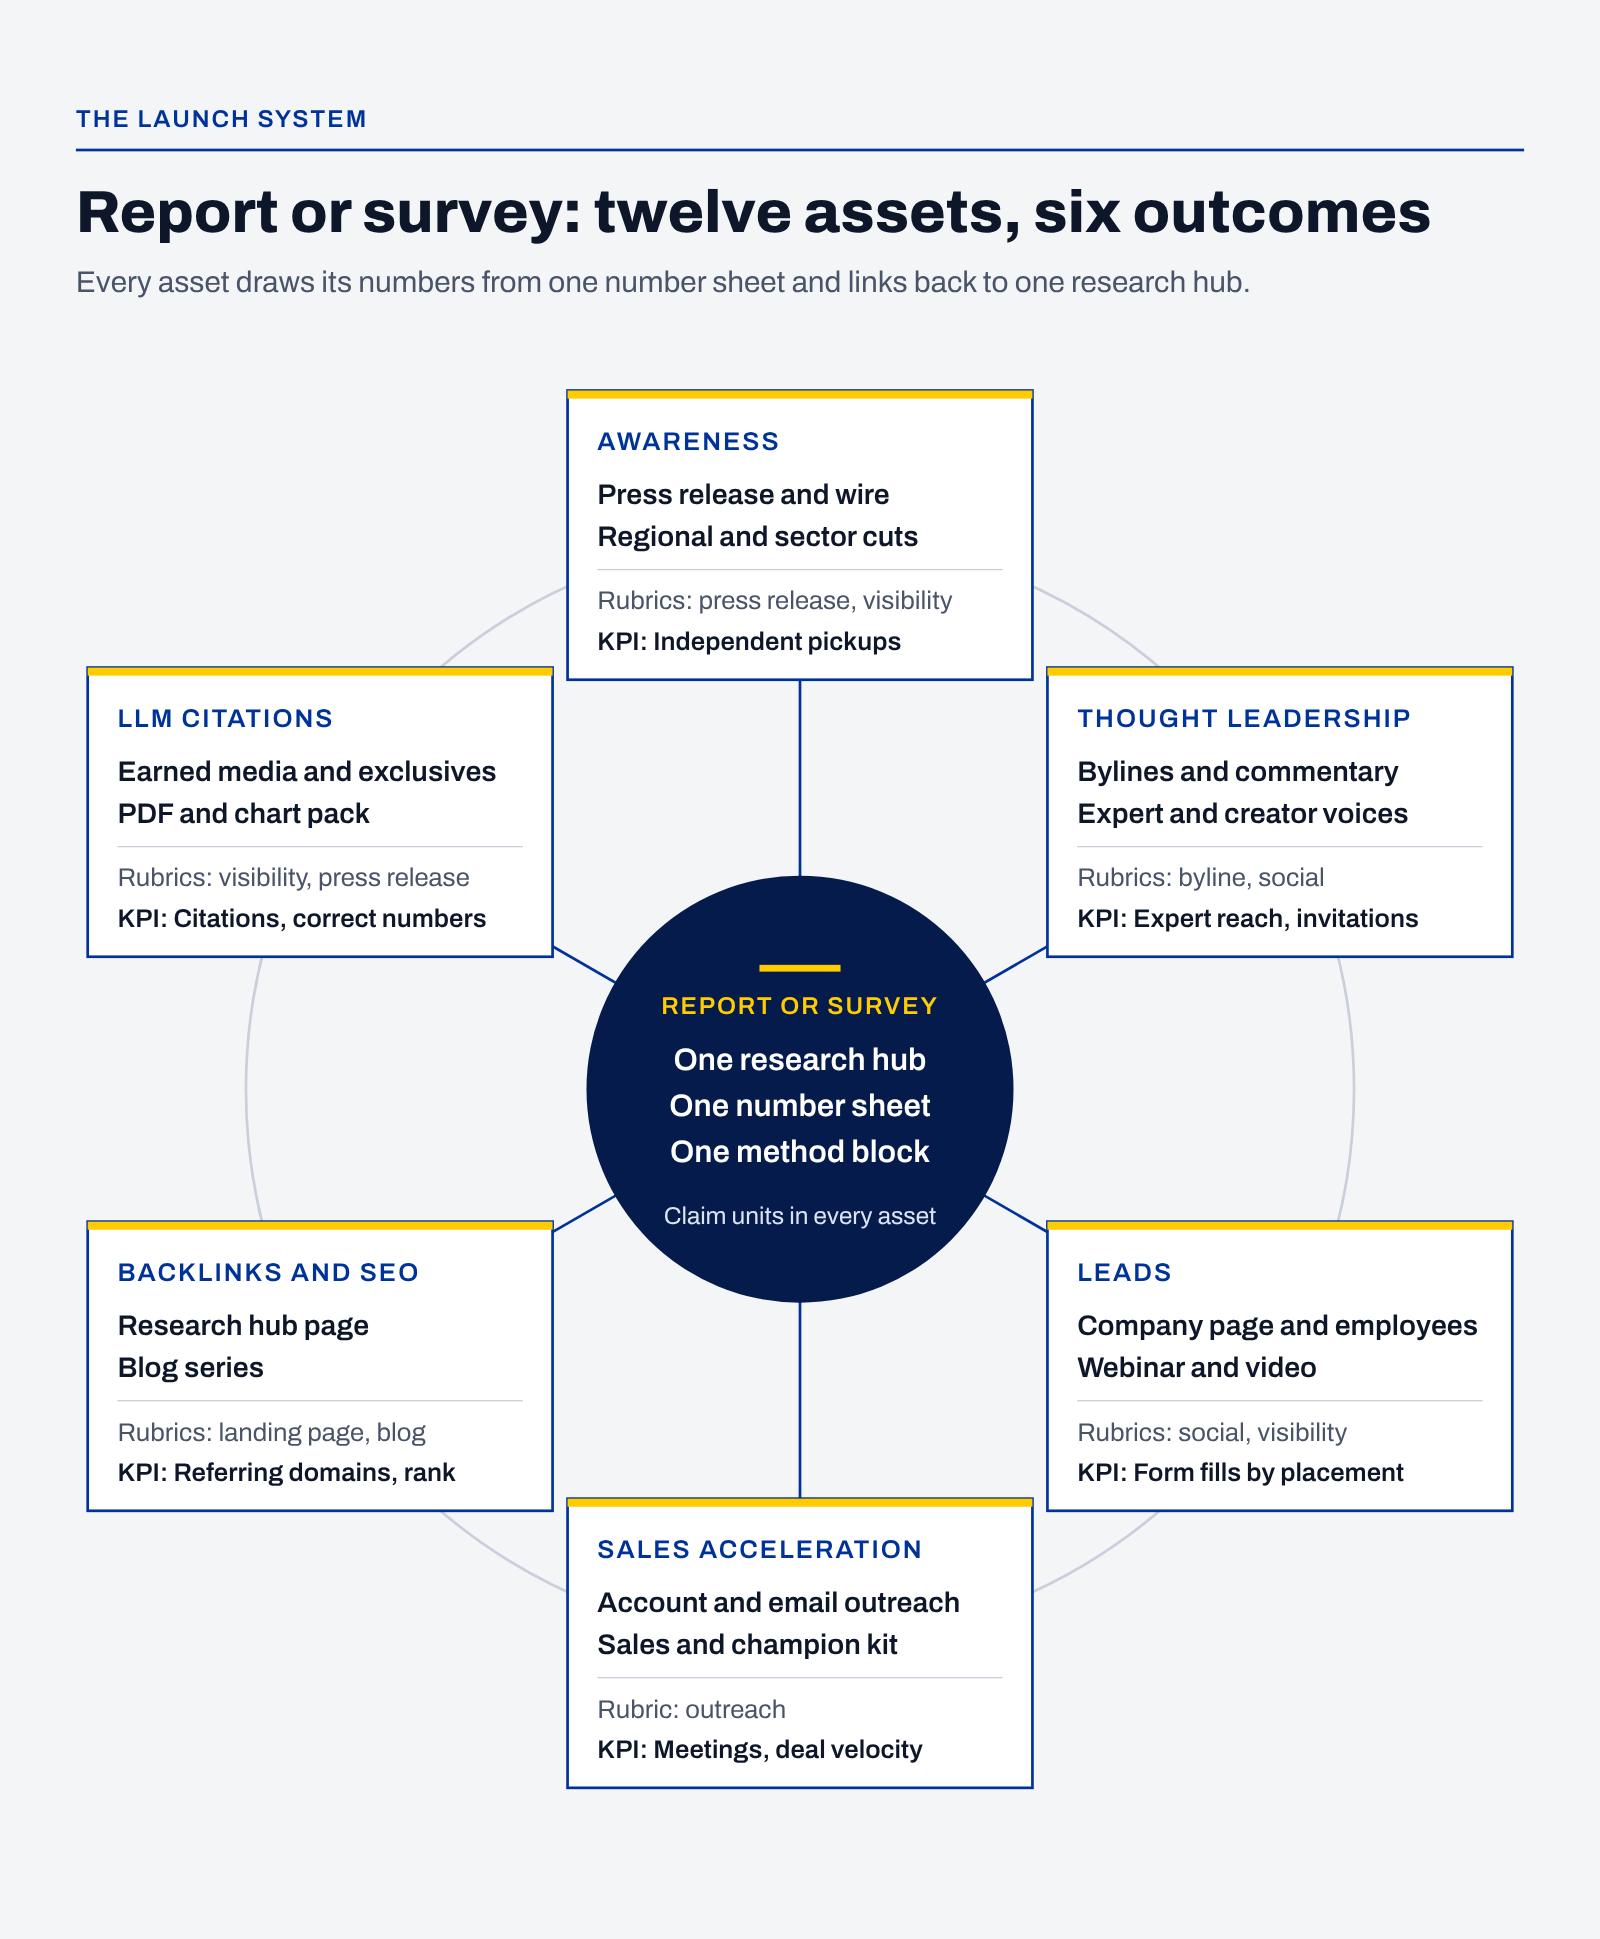
A research launch is a system with the report or survey at its center
Treat the launch as one research hub with assets that link back to it. Every asset pulls its numbers from one number sheet and moves an outcome someone on your team owns.
Text version of this figure
| Asset | Outcome it moves most | Scored by |
|---|---|---|
| Press release and wire | Awareness | Press release and media; launch visibility |
| Regional and sector cuts | Awareness | Press release and media; launch visibility |
| Bylines and expert commentary | Thought leadership | Byline rubric |
| Expert and creator voices | Thought leadership | Social amplification |
| Company page and employee posts | Leads | Social amplification |
| Webinar and video | Leads | Launch visibility; outreach |
| Account and email outreach | Sales acceleration | Outreach |
| Sales and champion kit | Sales acceleration | Outreach |
| Research hub (landing page) | Backlinks and SEO | Landing page; launch visibility |
| Blog series, one finding per post | Backlinks and SEO | Blog post; launch visibility |
| Earned media and exclusives | Citations in LLM answers | Press release and media; launch visibility |
| PDF and chart pack | Citations in LLM answers | Launch visibility; press release and media |
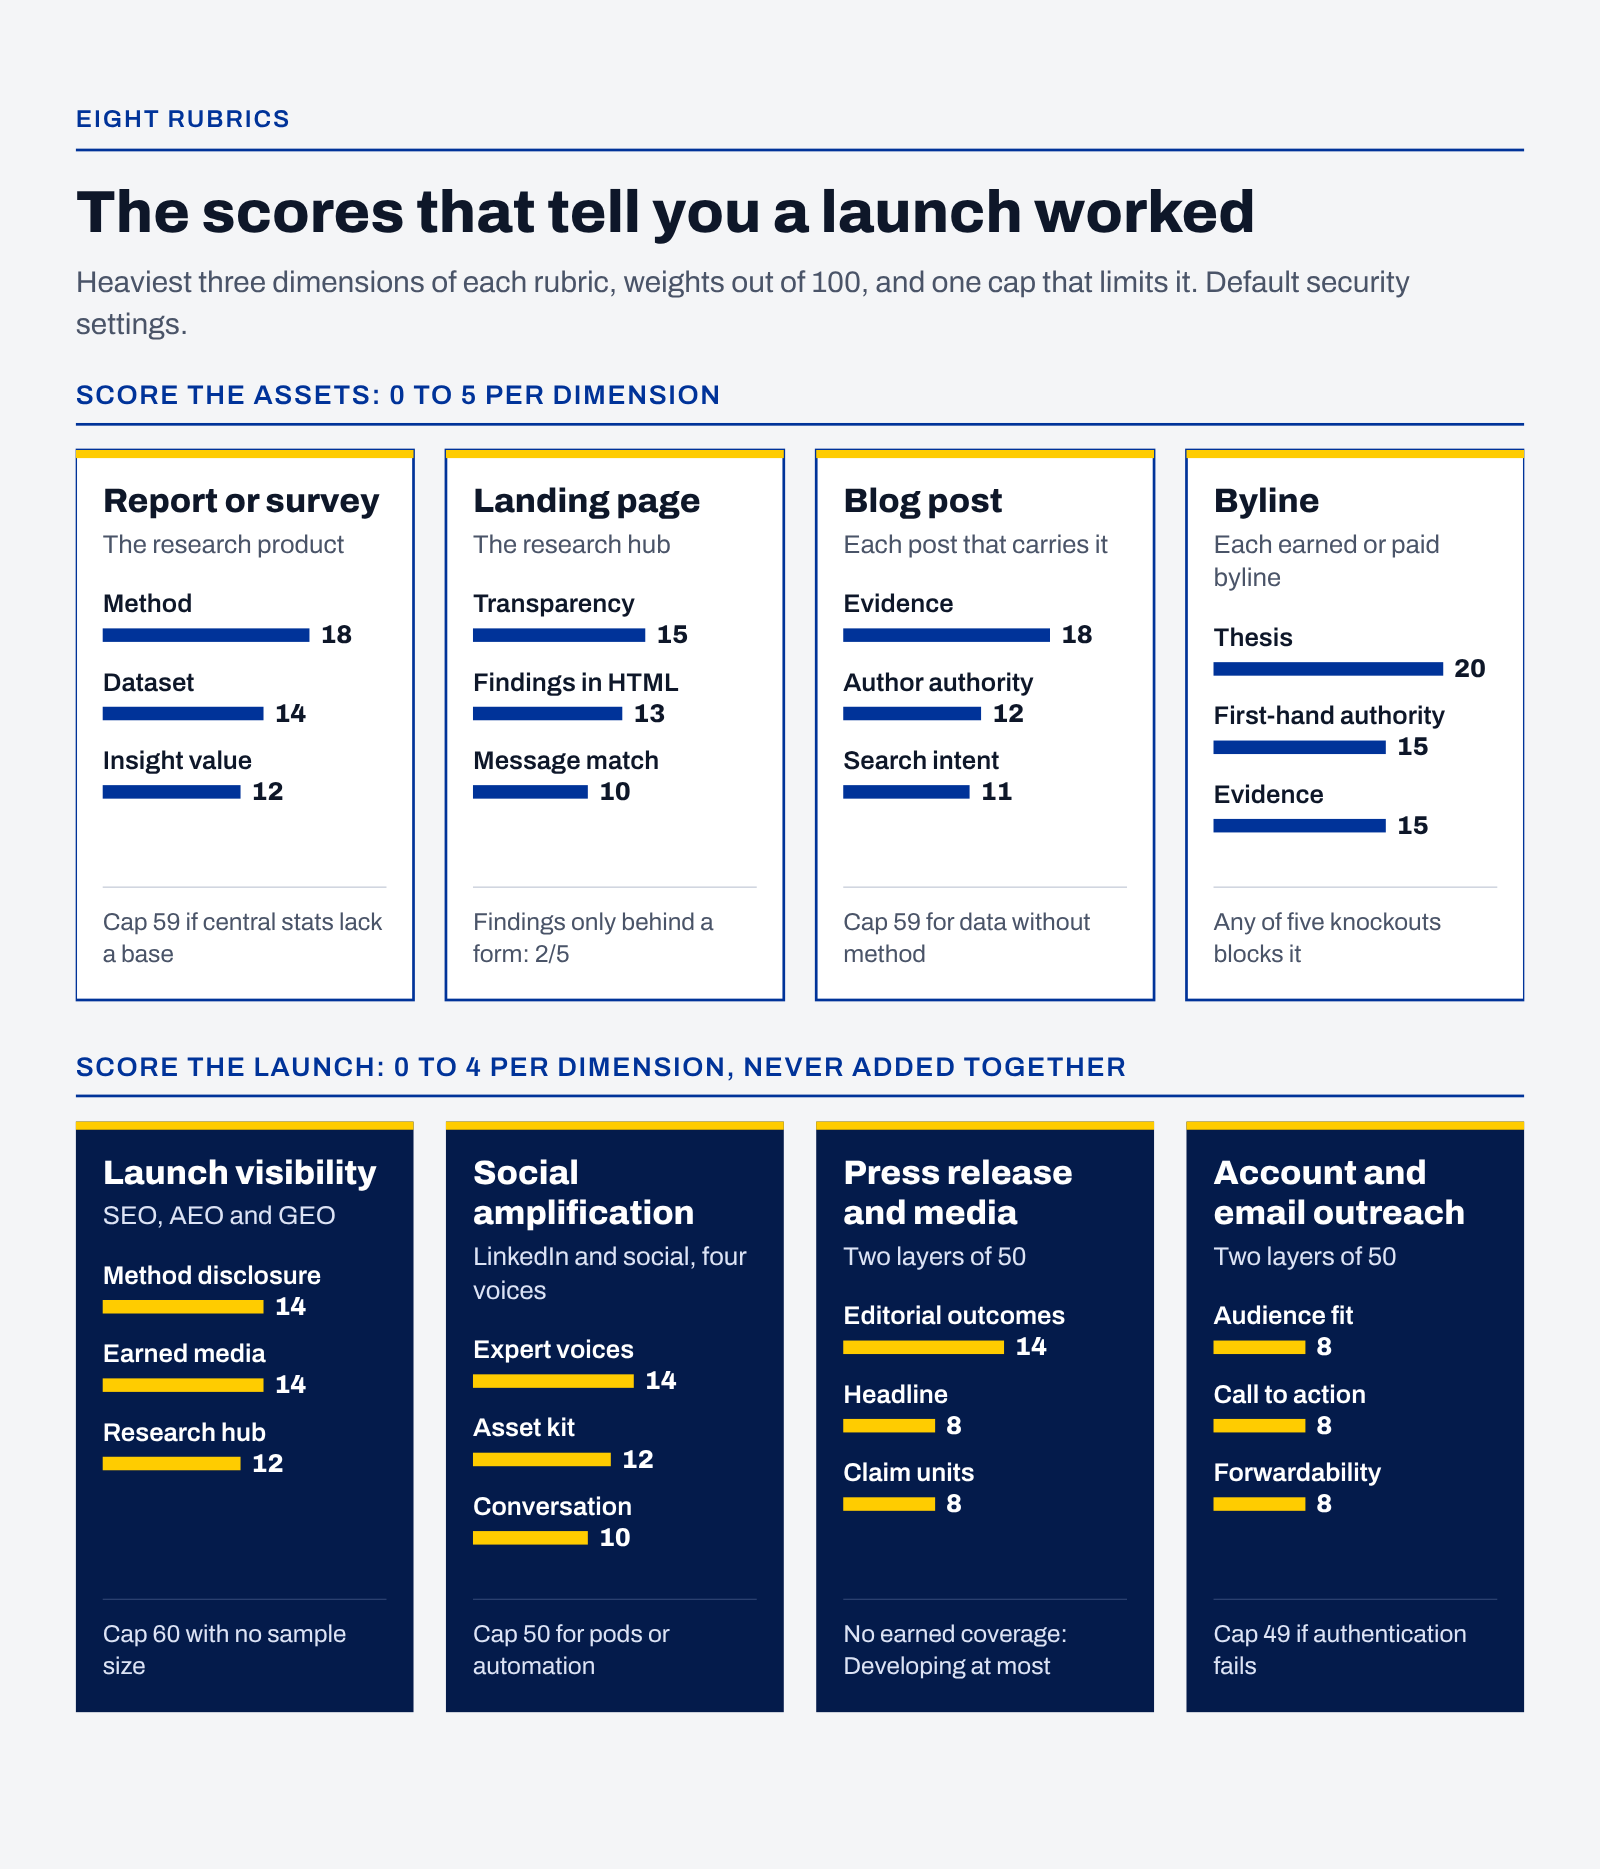
Eight rubrics, and what each one rewards
Four rubrics score the assets, 0 to 5 per dimension. Four score the launch, 0 to 4 per dimension. Compare launch scores side by side, and never add them together.
Text version of this figure
| Rubric | Scores | Heaviest dimensions (weight of 100) |
|---|---|---|
| Report or survey | The research product | Method 18, dataset 14, insight value 12 |
| Landing page | The research hub | Research transparency 15, findings in HTML 13, message match 10 |
| Blog post | Each post that carries the research | Evidence 18, author authority 12, search intent 11 |
| Byline | Each earned or paid byline | Thesis 20, first-hand authority 15, evidence 15 |
| Launch visibility | SEO, AEO and GEO for the launch | Method disclosure 14, earned media and links 14, research hub 12 |
| Social amplification | LinkedIn and social, four voices | Executive and expert voices 14, asset kit 12, four dimensions at 10 |
| Press release and media | The release and the media program, 50 points each | Independent editorial outcomes 14, headline 8, claim units 8 |
| Account and email outreach | Customer, partner and prospect outreach, 50 points each | Audience fit 8, call to action 8, forwardability 8, deliverability 8 |
How the scoring works:
- Not verifiable isn't zero. When a public review can't see something, such as open rates, the score rescales and reports coverage. Compare launches only above 75% coverage and at the same launch age.
- Caps are ceilings. A total can't pass its cap until you close the gap.
Report or survey rubric: method and claim units come first
Three terms carry this rubric:
- Method: how the team ran the study: who it surveyed or measured, how many, how it recruited them, when, and how it worded questions and weighted answers.
- Dataset: whether the data can carry the claims, with enough responses in each cut, medians beside means and a base for every percentage.
- Insight value: whether a finding tells buyers something new they can act on.
Incident and telemetry studies need a method too. Verizon's 2026 DBIR, its 19th edition, says it analyzed more than 31,000 incidents, more than 22,000 of them confirmed breaches, in 145 countries, and explains how its charts show uncertainty. I haven't scored the public reports I cite; each one shows a single practice.
| Dimension | Weight |
|---|---|
| Research integrity and methodology | 18 |
| Dataset adequacy and statistical validity | 14 |
| Insight value and buyer relevance | 12 |
| Actionability and journey coverage | 10 |
| SEO, AEO and GEO readiness | 10 |
| Trust, authorship and sourcing | 9 |
| Narrative and editorial quality | 8 |
| Data presentation and accessibility | 7 |
| Conversion and landing-page experience | 5 |
| Activation, reuse and measurement | 4 |
| Governance, privacy and lifecycle | 3 |
Bands: 90 and above is category-defining, 80s excellent, 70s strong, 60s adequate, 50s weak, and below 50 means don't publish. Caps:
- no method, population or period: 49
- central statistics without a base, or causal claims from correlation: 59
- telemetry from your own customers with no limitations section: 69
Best practices that earn the method and dataset points:
- Disclose what survey researchers expect. Follow the disclosure standards of the American Association for Public Opinion Research (AAPOR): sponsor and who ran the study, population, recruitment, mode, field dates, sample sizes, question wording, weighting and limits. IBM names both roles: conducted by Ponemon Institute, sponsored and analyzed by IBM.
- Write headline numbers as claim units: finding, population, denominator, period, unit, comparison and source. Compare "breaches cost $5 million" with IBM's version: a global average breach cost of USD 4.99 million in its Cost of a Data Breach Report 2026, up 12% from the prior year, across 602 organizations breached from March 2025 to February 2026.
- Put medians beside means for money and time. A few large answers inflate a mean.
- Show the base for every cut. Treat subgroups under 100 as directional and suppress cells under 30.
- State the margin, or why there isn't one. A probability sample of 1,000 carries about ±3.1 points, and 400 carries about ±4.9. For opt-in panels, write "if this were a probability sample".
Landing page rubric: findings before the form
Keep the lead form; gating the full PDF is a fair trade. This rubric scores where findings sit and how much friction the form adds. Research transparency (15) and findings in HTML (13) weigh most. Caps:
- core findings only behind a form: findings and AEO readiness capped at 2 of 5
- a noindex tag or blocked crawlers: SEO, AEO and GEO dimensions zeroed
- image-only charts: visual evidence capped at 2 of 5
Google says AI Overviews and AI Mode have no additional requirements beyond appearing in the index and qualifying for a snippet. Microsoft advises against relying on PDFs for core information or putting key information only in images.
Launch visibility: the score for SEO, AEO and GEO
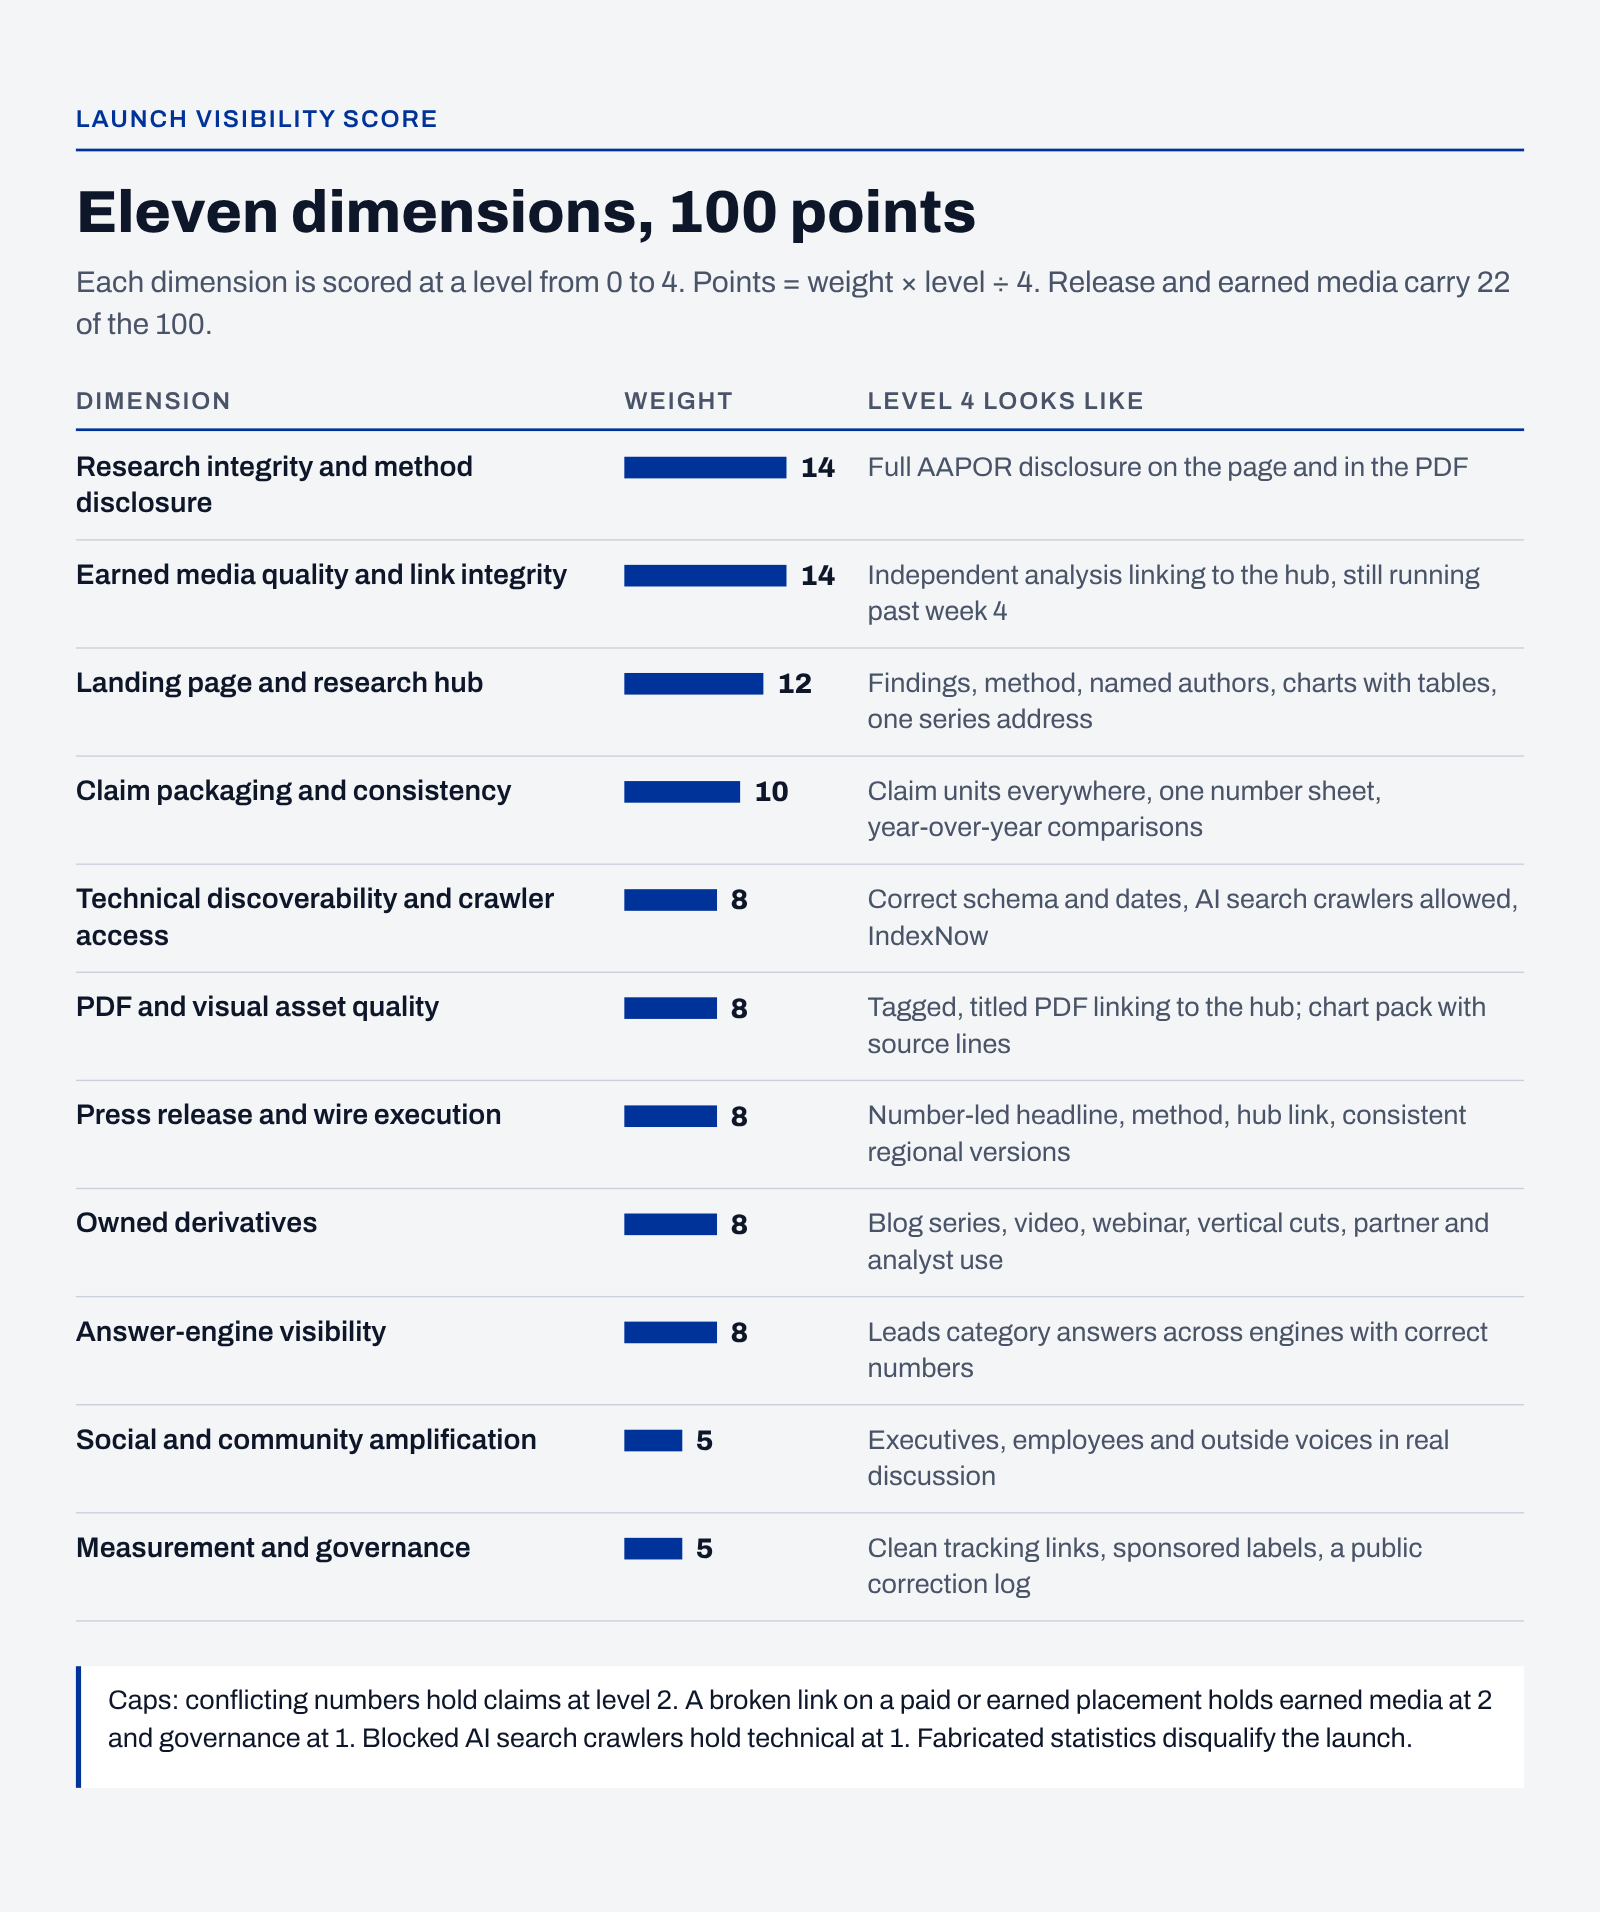
Launch visibility rates what anyone can see of the launch. Release and earned media carry 22 of its 100 points, because search and answer engines reward coverage that names and links your research.
Text version of this figure
| Dimension | Weight | Level 4 looks like |
|---|---|---|
| Research integrity and method disclosure | 14 | Full AAPOR disclosure on the page and in the PDF |
| Earned media quality and link integrity | 14 | Independent trade or tier-1 analysis linking to the hub, still running after week 4 |
| Landing page and research hub | 12 | Findings, method, named authors, charts with tables, one series address |
| Claim packaging and consistency | 10 | Claim units everywhere, one number sheet, year-over-year comparisons |
| Technical discoverability and crawler access | 8 | Correct schema and dates, AI search crawlers allowed, IndexNow |
| PDF and visual asset quality | 8 | Tagged, titled PDF that links to the hub; a chart pack with source lines |
| Press release and wire execution | 8 | Number-led headline, method, hub link, consistent regional versions |
| Owned derivatives | 8 | Blog series, video, webinar, vertical cuts, partner and analyst use |
| Answer-engine visibility | 8 | Leads category answers across engines with correct numbers |
| Social and community amplification | 5 | Executives, employees and outside voices in real discussion |
| Measurement and governance | 5 | Clean tracking links, sponsored labels, a correction log |
Caps catch the failures that travel:
- conflicting numbers across official versions: claim packaging capped at level 2
- a broken link from a paid or earned placement: earned media capped at 2, governance at 1
- AI search crawlers blocked: technical discoverability capped at 1
- fabricated or unverifiable statistics: launch disqualified
Evidence behind the scoring, graded the way the skill grades it (A is strongest):
- Earned media feeds answer engines (C, vendor data). Muck Rack's Generative Pulse found more than 84% of AI citations come from earned and third-party sources and 0.3% from paid and advertorial content, across 207 million citations in 2026.
- Packaging matters (C, vendor data). Across 26,670 GlobeNewswire releases, Notified found that releases with topical subheadings drew 61% more AI citations, and research showed no lift unless the release said what was new. Notified operates GlobeNewswire, so read these as associations.
- Statistics and quotations help (B, peer reviewed). In the GEO paper (KDD 2024), the best methods, including adding statistics and quotations, raised visibility in generative engine answers by up to about 40%. Keyword stuffing didn't.
Skip two myths:
- Myth: you need llms.txt or special schema. Google's guide to generative AI features in Search says you don't need AI text files, special schema or content chopped into small pieces.
- Myth: blocking GPTBot keeps you out of ChatGPT search. OpenAI documents separate crawlers, and OAI-SearchBot is the one that controls search.
Social: four voices, scored on conversation
Social amplification scores the campaign across four voices: the company page, executives and experts, employees, and outside voices such as creators, analysts and media. Expert voices weigh most (14), then the asset kit (12).
- Build the kit for the feed. Level 3: a document carousel with one finding per slide, a method slide, stat cards with source lines and a short video. Level 4 adds a native article and Thought Leader Ad variants.
- Give each expert an angle. Level 3: three or more relevant experts with their own takes, active in the comments. Level 4 adds a research lead's "how we did it" post.
- Measure conversation, not volume. Level 3: at least 40% of comments add something.
Caps: pods or automation cap the total at 50, and reposts in place of original employee posts cap executive and employee voices at level 1.
Press release and media: two layers of 50
Layer A scores the release, and layer B scores the media program behind it. Grades: Benchmark 85 and above, Strong 70 to 84, Developing 55 to 69, Foundational below 55. Without independent editorial coverage, a launch can't grade above Developing.
A level-4 release has:
- Headline: one specific number, a precise population and a consequence, in 100 characters or fewer.
- Lead: a second number and a method cue, with who, what, how many, when and so what in 70 words or fewer.
- Method block: firm, sponsor, dates, mode, population, sample by segment, weighting and a questionnaire link.
- Findings: five to eight under descriptive headings, plus a sector or regional table.
- Chart pack: a hero chart and three to six more, each with alt text, a source line inside the image and reuse rights.
- Quote and access: one interpretive quote tied to a number, and an interview offer.
- Links: a descriptive link to the ungated web page and a named press contact.
Layer B rewards a tiered target list, one-to-one pitches, a single-angle exclusive under embargo, spokespeople reporters can interview, and regional or sector spin-offs over six to twelve weeks. IBM follows its global Cost of a Data Breach release with regional releases, and Verizon publishes DBIR industry snapshots. In Cision's 2026 State of the Media survey of 1,899 journalists, original research, expert access and embargoed information topped what they value in pitches, and 53% objected to AI-generated pitches (C).
Bylines: five knockouts before any score
Every byline must pass five knockouts: no promotion, outlet rules followed, statistics sourced, company research disclosed, and claims approved by the named author. Any fail blocks submission. Nine weighted criteria follow, led by thesis (20), first-hand authority (15), evidence (15) and practical utility (15). At 85 or more, pitch a tier-1 outlet; below 55, run it as a company blog post.
Account and email outreach: what sales can forward
Outreach scoring covers how the research reached customers, partners and prospects. Layer A covers the message and assets; layer B covers the program, deliverability and outcomes, which need owner data. Below 75% coverage, the skill reports "insufficient evidence" instead of a score.
- One email, one audience, one claim unit, with an honest subject line of three to seven words and one call to action that fits the stage.
- Keep it short: cold emails under 80 to 100 words, warm ones under about 150.
- Make it forwardable: a champion kit with a summary, charts, a business-case slide and a draft internal email, all linking to an ungated findings page.
- Measure replies and meetings, not opens.
Caps: failed authentication or no working unsubscribe caps the total at 49, a deceptive subject line at 59, and numbers that conflict with the report at 69.
What two real security launches scored
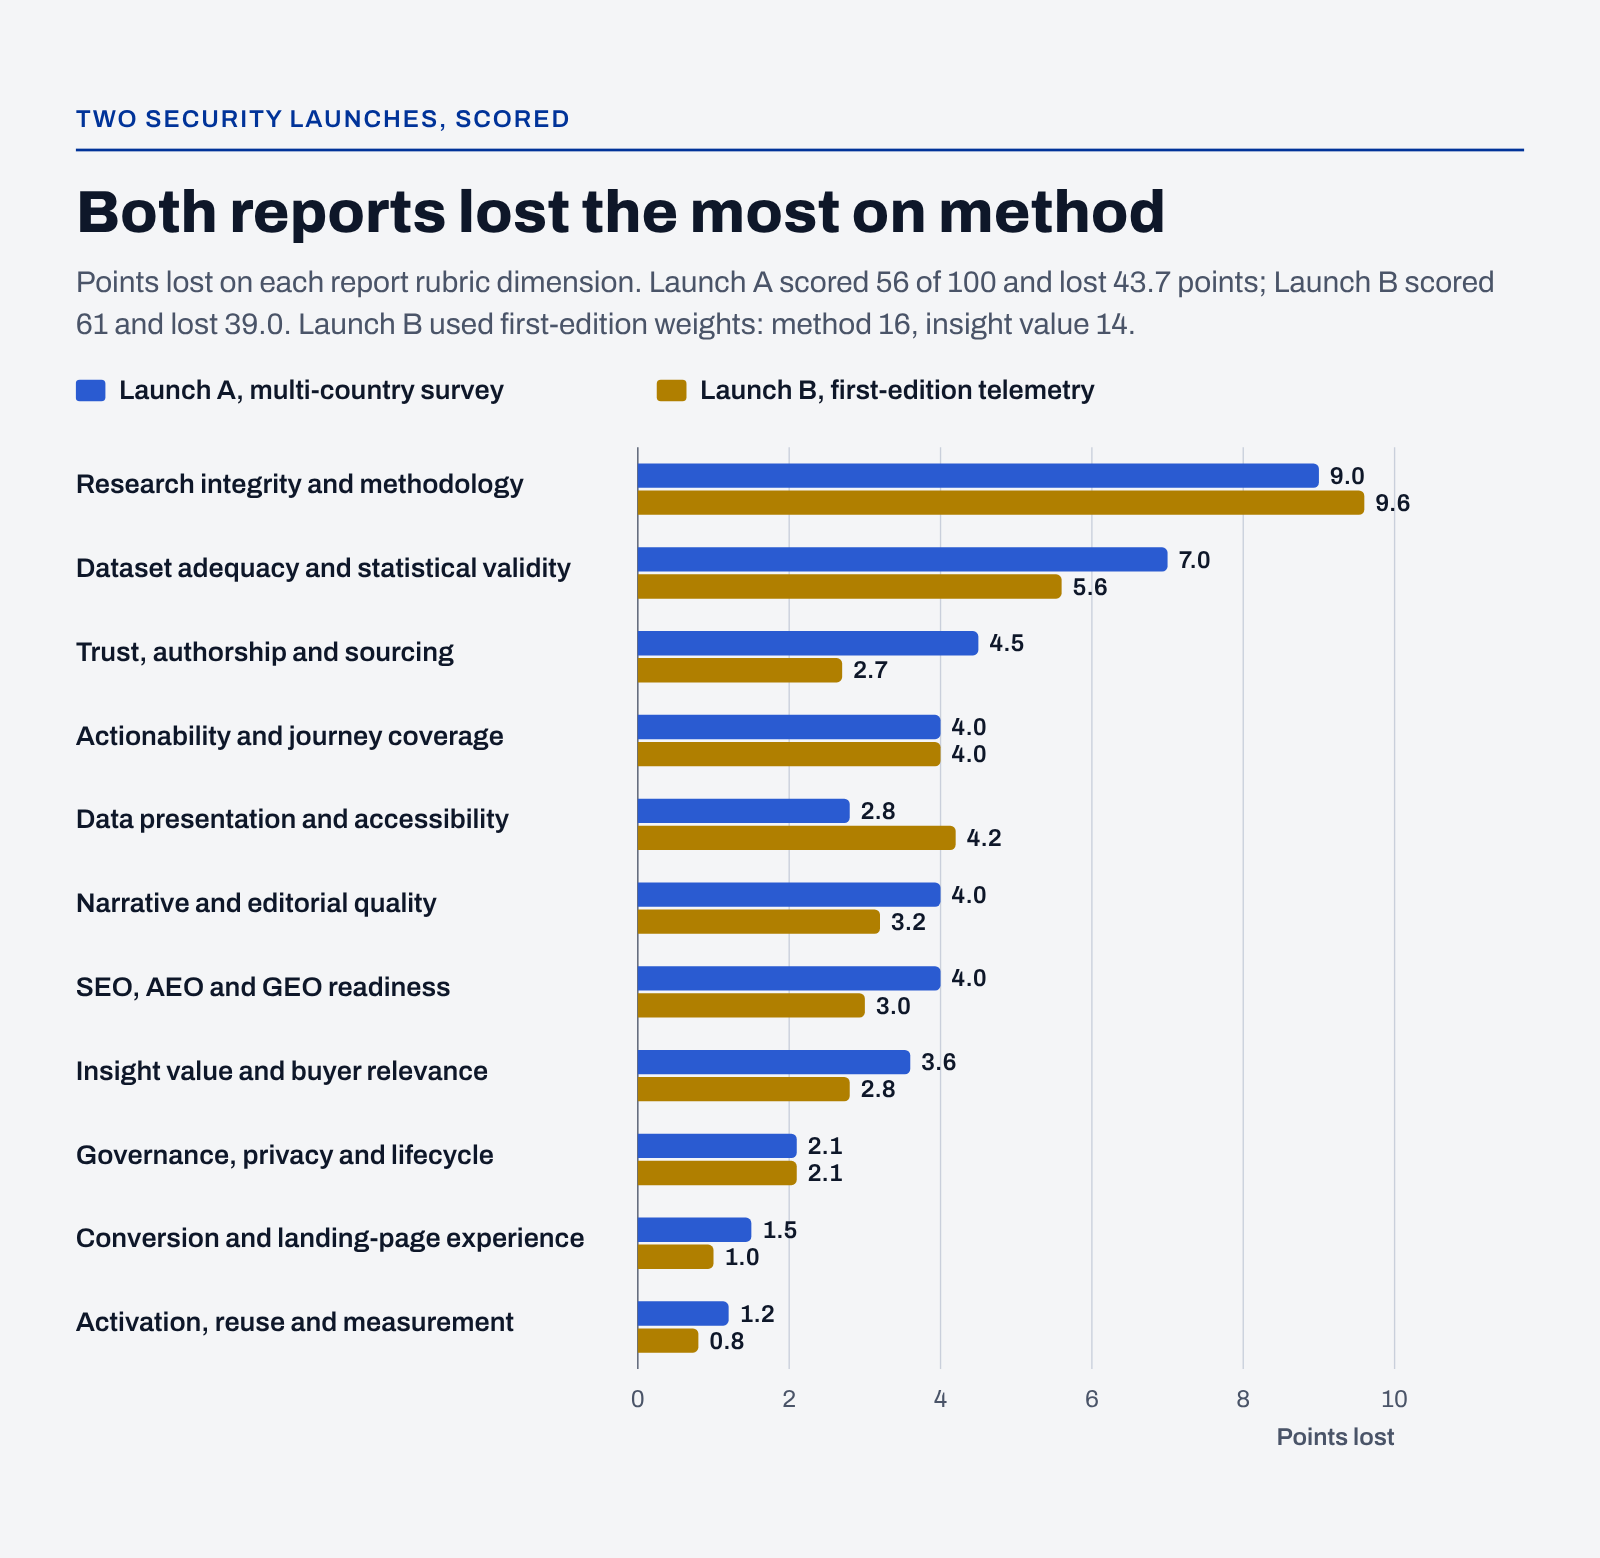
Here are two security launches I've scored, with company names removed.
Text version of this figure
| Dimension | Launch A, points lost | Launch B, points lost |
|---|---|---|
| Research integrity and methodology | 9.0 | 9.6 |
| Dataset adequacy and statistical validity | 7.0 | 5.6 |
| Trust, authorship and sourcing | 4.5 | 2.7 |
| Actionability and journey coverage | 4.0 | 4.0 |
| Data presentation and accessibility | 2.8 | 4.2 |
| Narrative and editorial quality | 4.0 | 3.2 |
| SEO, AEO and GEO readiness | 4.0 | 3.0 |
| Insight value and buyer relevance | 3.6 | 2.8 |
| Governance, privacy and lifecycle | 2.1 | 2.1 |
| Conversion and landing-page experience | 1.5 | 1.0 |
| Activation, reuse and measurement | 1.2 | 0.8 |
What else cost points:
- Numbers drifted. A Launch A figure appeared with different rounding in the report and the release, and Perplexity quoted the release. Answer engines repeat whatever version they find.
- A blog beat the landing page. Google's AI Overview cited Launch A's launch blog, which stated the finding as a full sentence, instead of its report page.
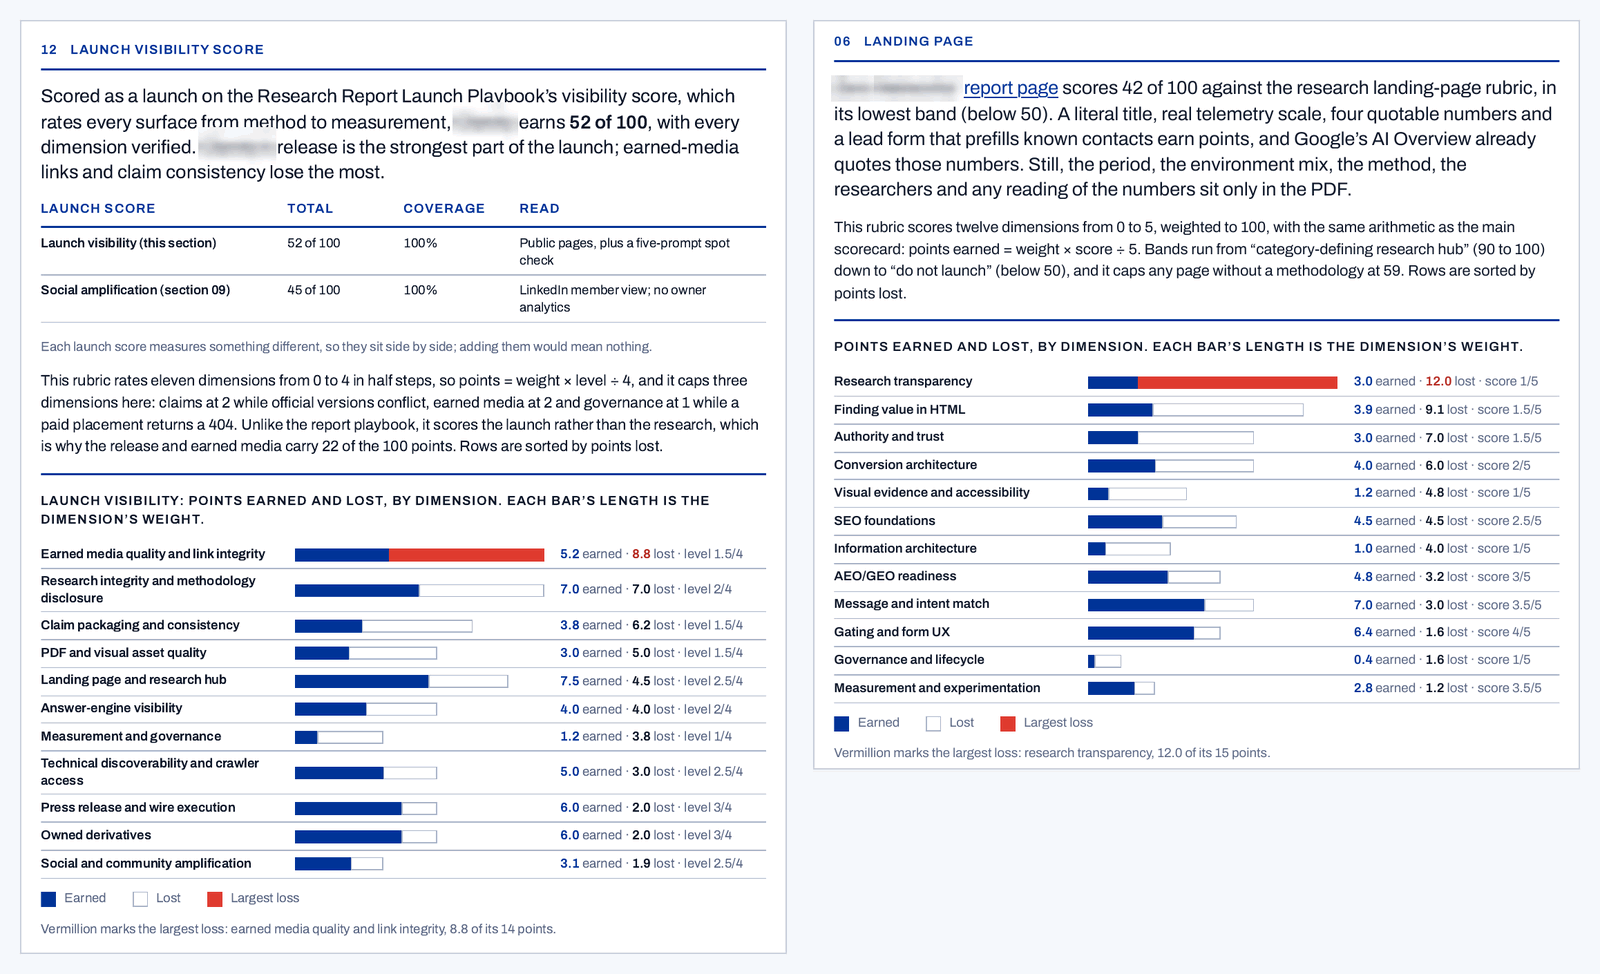
- One broken link cost two dimensions. A paid placement linked to an error page, capping earned media and governance. Earned media lost 8.8 of 14 points, the biggest loss in a launch visibility score of 52.
- Comments added little. Launch A's social score was 45 of 100. Only 4 of 40 comments on the busiest posts added anything.
- Launch B won without its landing page. Its first-place rankings and citations came despite a landing page score of 42 of 100. On the one prompt it missed, Perplexity said no industry-wide figure existed. Launch B had one, but not as a sentence on any web page.

Small edits, outsized returns: the ROI and KPI table
Most of the lift needs no new research. Each row is editing, QA or packaging work on research you've already paid for.
| Edit | Effort | Who gains | KPI to watch | Lift in the reviews | Evidence |
|---|---|---|---|---|---|
| Method block, findings as sentences and a table under each chart on the landing page | Hours | SEO, AEO and GEO owner; PR | Search Console's Generative AI performance report; Bing AI Performance citations | Launch A visibility: method +3.5, hub +3.0 | A: Google, Microsoft |
| One number sheet, checked against every asset | A day | PR, analyst relations, SEO | Correct statistic in buyer prompts | Launch A visibility: claims +3.8 | C: Notified |
| Link and tracking check on every placement within 48 hours | An afternoon | Demand generation | Form fills by placement; zero broken links | Launch A visibility: governance +2.5, cap lifted | D |
| PDF title, author, tags, bookmarks and a link to the hub | An hour | SEO owner | Clicks from the PDF to the hub | Launch A visibility: PDF +3.0 | D |
| Medians beside means, and a base for every cut | Hours | Research lead, PR | Fewer method questions from reporters | Launch A report: dataset +4.2 | A: AAPOR |
| Release headline with one number and its population, under 100 characters, plus descriptive subheads | An hour | PR | Independent pickups; interview requests | Release headline, level 2 to 4: +4.0* | C: Notified |
| Carousel with one finding per slide and a method slide, plus three experts with their own angles | A day | Social, demand generation, executives | Saves, sends, qualified comments | Launch A social: kit +3.0, experts +3.5 | D |
| Champion kit: summary, charts, business-case slide, internal email draft | A day | Sales and customer success | Meetings, reopened opportunities, deal velocity | Outreach forwardability, level 1 to 3: +4.0* | D |
*From the rubric weights. Other lifts come from the two reviews' fix tables.
How to run it on your next report or survey
- Lock the data four to six weeks out in one number sheet: every statistic, its denominator and its rounding rule.
- Run the pre-launch review and fix every blocker.
- Record a buyer-prompt baseline of five prompts, with no embargoed numbers.
- Publish in order: the HTML hub, live and in the sitemap, then the PDF, newsroom copy, wire release and social. An IndexNow ping reaches Bing, Naver, Seznam, Yandex and Yep, but not Google.
- Check every placement's link within 48 hours.
- Rerun the review at day 7, 30 and 90, and compare matched dimensions in the Studio.
- Score a competitor's launch at the same age to set the bar for your next edition.
One report or survey should feed every team. My map of AI use cases by marketing team shows what PR, analyst relations, demand generation and sales build from one research asset.
Where the scores can mislead
Get the skill
Report launch review runs in Claude with code execution, web search and Claude in Chrome, which reads LinkedIn and served pages; without Chrome, those dimensions read as not verifiable. Inside the zip: the skill, the eight rubrics and their source playbooks, the review build kit, three category settings and the Launch Review Studio. Ask me for it, and tell me your category and whose launch you'll score. For help running it on a launch, see my advisory work.
FAQ
How do you optimize B2B survey and research report assets?
Optimize them as one system around one research hub, not as a PDF and a press release. Put the method and three to seven findings on an indexable web page, build every asset from one number sheet, lead the press release with one complete statistic, give experts their own angles and hand sales a kit they can forward. Then check every placement's link within 48 hours and measure at day 7, 30 and 90.
Should you gate a research report or survey?
Gate the full report if you need leads, but never the findings. Put three to seven key findings and the method on an ungated web page, as text with charts and tables. Google says its AI features have no additional requirements beyond an indexed page that's eligible for a snippet, and Microsoft advises against keeping core information only in PDFs or images.
How do you get a research report or survey cited in LLM answers?
Make each finding easy to find, trust and quote. Write each headline number as a claim unit, a complete sentence with its population, base, period and source, on an indexable web page, and keep that number identical in every version. Then earn independent coverage that names and links the research: Muck Rack's Generative Pulse found more than 84% of AI citations in 2026 came from earned and third-party sources.
Do llms.txt files or special schema help research get cited by LLMs?
No, not in Google Search. Google's guide to generative AI features says you don't need AI text files such as llms.txt, special schema or content split into small pieces. Findings on an indexable page, consistent numbers and earned coverage that links the research matter more.
How much does a B2B research report or survey cost?
In my experience, a study costs as much as $25,000 from a small independent research firm and starts at $60,000 at a top-five analyst firm, rising when you add a webinar or podcast. Some reports cost $200,000 or more, which is why the launch deserves as much care as the data.
What KPIs show that a research report or survey launch worked?
Track independent pickups that link to the research, correct statistics in a fixed set of buyer prompts, AI citations in Search Console and Bing Webmaster Tools, form fills by placement, and meetings and reopened opportunities on deals the research touched. Opens and impressions don't show whether the research changed a decision.
Sources
- Ponemon Institute and NOLA Marketing, The State of Cybersecurity Marketing Influence 2026
- IBM, Cost of a Data Breach Report 2026, report page
- IBM Middle East and Africa newsroom, IBM Study: Average Data Breach Cost in the Middle East Reaches $8 Million in 2026, August 3, 2026 (method: Ponemon Institute, 602 organizations, March 2025 to February 2026)
- Verizon, 2026 Data Breach Investigations Report, report page
- Verizon, 2026 DBIR executive summary
- AAPOR, Disclosure Standards, from the AAPOR Code of Professional Ethics and Practice (April 2021)
- Google Search Central, AI features and your website
- Google Search Central, Google's guide to optimizing for generative AI features on Google Search, updated July 10, 2026
- Microsoft Advertising, Optimizing Your Content for Inclusion in AI Search Answers, October 8, 2025
- Bing Webmaster Blog, Introducing AI Performance in Bing Webmaster Tools, February 10, 2026
- OpenAI, Overview of OpenAI crawlers
- Muck Rack Generative Pulse, Earned media still drives more than 84% of AI citations, October 28, 2026 (vendor data)
- Notified, Press releases with descriptive section headings receive 61% more AI citations, October 29, 2026 (vendor data; 26,670 releases)
- Aggarwal et al., GEO: Generative Engine Optimization, KDD 2024
- Cision, 2026 State of the Media, May 13, 2026 (1,899 journalists)
- IndexNow
Topics: b2b-research, launches, seo-aeo-geo, public-relations, cybersecurity-marketing. How I research and write these posts: editorial standards.